Meteorology of September 11, 2001
September 11, 2001 (also commonly known as 9/11) is unquestionably one of the darkest days in the history of the United States. Almost 3000 people were killed in a terrorist attack that involved the suicidal hijacking of four commercial airplanes. Two airplanes were crashed into the World Trade Center, one was crashed into the Pentagon, and one crashed near Shanksville, Pennsylvania after the passengers heroically attempted to retake control of the airplane. There are millions (if not billions) of personal stories from people detailing what they saw, heard, felt, and experienced that day. Many of the most well-known stories come from the exceptionally brave first responders, tenants who selflessly rescued other tenants, survivors, firsthand witnesses, aviators (on the ground and in the air), newscasters (in the field and in the studio), and many more. However, most people were watching the horrors unfold on TV (either live or after the fact). Despite happening over 20 years ago, the effects of 9/11 are still felt by everyone in the world to this day.
One thing that I have not seen documented (at least, not in the public domain and in plain language) is a comprehensive analysis of the meteorological conditions and how they directly affected the attacks. There were a few articles written about Hurricane Erin (2001) and the large-scale patterns that prevented Erin from causing an even more unthinkable tragedy in the Northeast. However, there is a lot more to the meteorological side of the story than what is publicly available.
That will be the main subject of this article: a critical analysis of what atmospheric factors made that day worse and what factors prevented that day from being worse than it was. I also want to preface this by saying this was not at all easy to write. Sometimes, I could only write one or two sentences before needing a break recollect myself. I realize that this might be even more difficult to read, but I believe it is important for people to fully understand how atmospheric patterns influenced that dark day.
Part I: Large-Scale Pattern
This synopsis will follow a largely chronological order, starting with September 10, 2001. Here's a look at a weather map from 8:00 AM EDT on September 10:
Surface observations on September 10, 2001 at 1200Z (8:00 AM EDT).
For those that do not have a background in weather, here is an explanation of what all of the lines, numbers, and symbols on the map mean. Each blue circle represents a weather station that is reporting current conditions (pressure, temperature, dewpoint, wind, sky cover, and weather). The fraction of the circle that is shaded is the fraction of the sky that is obscured by clouds (e.g. a fully shaded circle means cloudy or overcast skies while a completely unshaded circle means clear or sunny skies). The red number to the top and left of each circle is the temperature (in Fahrenheit) while the green/brown number to the bottom and left of each circle is the dewpoint (in Fahrenheit). Essentially, higher dewpoint values indicate higher moisture content (higher humidity). There is also a straight line extending from the circle, which itself has additional lines poking out to the side. These are the wind barbs. The barb points in the direction that the wind is blowing from (so, a barb that extends to the northwest indicates a wind blowing from northwest to southeast). On the barb, a long line indicates 10 knots, a short line indicates 5 knots, and a combination of the two should be treated as a sum (e.g. if one barb has two long lines and a short line, that is 10 + 10 + 5 = 25 knots). If a station doesn't have a wind barb, then the wind speed is either less than 5 knots or the wind direction is variable.

Some example wind barbs. The leftmost wind barb would be a wind blowing from northwest to southeast at a speed of 35 knots (3 long sticks, 10 knots each, plus 1 short stick, 5 knots). The rightmost wind barb would be a wind blowing from west to east at a speed of 5 knots (1 short stick, which represents 5 knots).
The solid grey lines are "isobars" or lines of pressure. The numbers attached to the isobars represent the pressure value in millibars (mb). As a rule of thumb, any value less than 1013 mb would be "low pressure" and any value greater than 1013 mb would be "high pressure". Generally speaking, if isobars are closer together, the winds will be stronger, and, if isobars are farther apart, the winds will be weaker. There are also red L's, which indicate cyclones (low pressure centers) and blue H's, which indicate anti-cyclones (high pressure centers).
If we look at the first map from the morning of September 10, there are a couple features that stand out. One is the presence of numerous isobars around the Ontario/Quebec border in Canada. There is a fairly strong cyclone (area of low pressure) in that region with its associated cold front extending into New York, Pennsylvania, and West Virginia (see if you can spot the exact location by pinpointing the wind shift and where the temperatures transition from warm to cooler). Ahead of the cold front are some dewpoints in the 70s, indicating extremely moist (and very uncomfortable) air. The observations also indicate very cloudy skies, and there were some thunderstorms ongoing along the cold front.
Another feature that stands out is the large area of high pressure centered over Oklahoma, which will build eastward with the cold front as the cold front advances eastward. The clockwise flow around the anti-cyclone (high pressure) will also help transport colder and drier air from Canada into the United States.
The next map jumps ahead 12 hours, so this would be September 10th, 2001 at 8:00 PM EDT.
Surface observations on September 10, 2001 at 0000Z (8:00 PM EDT).
If you're following the position of the cold front, you may have noticed that it hasn't moved much and has even weakened a little bit. This is partly due to the fact that the parent cyclone has moved northward, which is limiting the front's ability to advance eastward. Also, the skies behind the cold front are sunny, which causes the cold side of the front to warm up (leading to additional weakening). Still, it has made some progress due to the clockwise flow pattern around the high pressure system that is now centered over southern Illinois.
You may have also noticed that the area of high pressure has been expanding eastward with the cold front, and this will become an important feature for the following morning.
Surface observations on September 11, 2001 at 1200Z (8:00 AM EDT).
Now, we see a map of conditions present at 8:00 AM EDT on September 11th, 2001. This is approximately 46 minutes before the first airplane hit the North Tower of the World Trade Center. You'll notice that the high pressure system has grown (and intensified) substantially (note how the 1024 mb pressure line is much larger on this map than the previous map). This, combined with the wind and moisture pattern on the coastline, suggests the cold front has made it to the coastal waters along the Northeast. This cold front will save the Northeast from a particularly nightmarish disaster by forcing Hurricane Erin, which peaked at Category 3 intensity, away from the coastline (for perspective, Sandy made landfall at Category 1 intensity).
Although Erin did not come too close to the northeast United States, the hurricane was close enough and strong enough to generate some rough waters along sections of the coastline (the unlabeled gray lines on the rightmost edge of the above image are isobars associated with Erin). This was discussed on many of the routine news shows that aired prior to the attacks. While the aforementioned cold front prevented Erin from causing more severe impacts to a badly devastated area, this cold front presented its own set of problems.
Cold fronts and the high pressure systems that follow their passage create a "stable atmosphere". Essentially, this means that the air near ground level cannot easily rise to higher altitudes. Therefore, any substance that exists near ground level will stay near ground level where many people are located. If you've ever been to a city known for air pollution, you might have seen something like this firsthand:
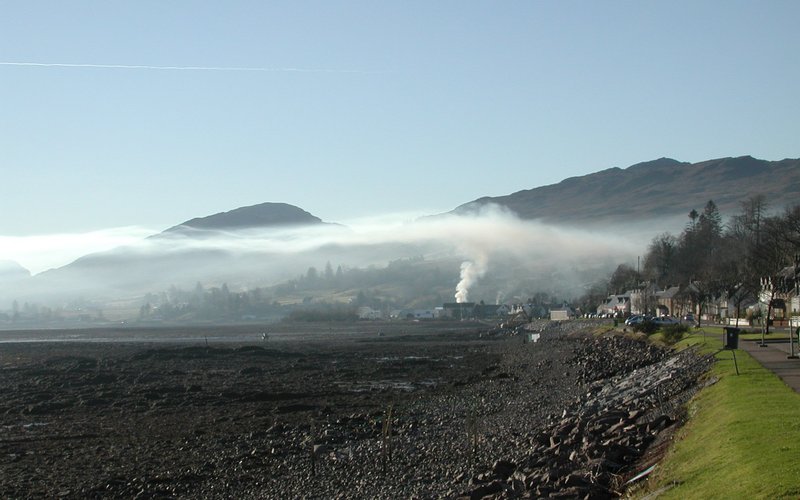
A stable atmosphere can create calm and pleasant weather conditions, but can also trap unwanted substances near the ground.
Notice how in this photograph there is a smoke stack that is releasing pollutants into the atmosphere, but those pollutants only get so high before they can't go any higher. This is a consequence of a stable atmosphere, something that will be present due to the cold front passage and the increase in air pressure.1 The existence of a stable atmosphere is evident in tower camera footage of Manhattan before anything malicious unfolds. If you watch any camera footage of New York before the attacks, take note of the haze (brown tint) that is present on the horizon; these are urban pollutants (albeit at relatively low concentrations) being trapped near ground level by the stable atmosphere.
If you watch any footage of the attacks, you'll notice the smoke plumes from the Twin Towers and the Pentagon rise very quickly at first, but the smoke quickly reaches a maximum altitude. As a consequence, particulates (smoke particles, microscopic bits of solid matter) are trapped in the lowest sections of the atmosphere. For this reason, some of the smoke found its way to the ground at some distance away from the towers and the Pentagon (this is noticeable on some footage). If you watch footage of the towers, you'll also notice that the smoke plume from the North Tower is blowing toward the South Tower, and this is another consequence of the cold front passage, which caused the winds to blow out of the northwest (toward the southeast).
Although the weather map shows weak winds (5 knots/6 mph at highest), heavily urbanized areas like New York City can do strange things to the wind patterns. Sometimes, the large concentration of buildings create so much drag that the air near the ground is completely calm. Sometimes, the narrow space between buildings can cause the flow to accelerate, and this will be something important to keep in mind later.2
Another important thing to mention is how stable (calm) weather affects aviation. In short, the conditions in New York were practically perfect for flying (some aviators refer to such conditions as "severe clear"). The stable conditions prevented any clouds from forming, and the weak winds mean that pilots largely don't have to worry about clear air turbulence or applying corrections to their course or their approach. Contrast this to stormy or unsettled weather patterns, which are at least partially blamed for a number of aviation accidents.
Delta Flight 191 is an example of how stormy weather can cause major problems. An otherwise forgettable thunderstorm quickly developed in the Dallas/Fort Worth area as the airplane was beginning its approach. The storm produced a rapidly descending current of air, known as a "microburst", which the airplane flew through. The pilots overcompensated for the wind stress and ended up crashing near the airport. Nowadays, pilots are trained to recognize microbursts and storms capable of microbursts to avoid them altogether, but modern day training also includes procedures on how to safely negotiate microbursts if they're unexpectedly encountered. If you're interested in learning more about the specifics of this particular accident, The National Weather Service has a great article about it.3
Anything in the atmosphere that reduces visibility (like precipitation and fog) or features strong winds can make flying much more stressful. Most people will agree that a substantial fraction of aviation accidents are at least partially attributed to poor weather. Nowadays, more advanced technology and improved scientific understanding of potentially hazardous weather has drastically reduced the number of weather-related aviation accidents.
Contrast this to New York City and Washington, DC on the morning of September 11 where it's hard to find a visual impediment or a strong wind gust. For this reason, many aviators immediately suspected something malicious was afoot when they heard about the first plane hitting the North Tower (some people were also listening to air traffic control and heard conversations about a possible hijacking that was being discussed). While aircraft have endangered tall manmade structures in the past, those incidents occurred when visibility was poor and airplanes were flying at a much lower speed since they're probably attempting to land at such a low altitude. An example of such an incident includes the B-25 bomber that crashed into the Empire State Building in 1945 (dense fog obscured the tower).4
Part II: Small-Scale Phenomena
At 8:46 AM EDT, American Airlines Flight 11 crashed into World Trade Center 1 (the North Tower). At 9:03 AM EDT, United Airlines Flight 175 crashed into World Trade Center 2 (the South Tower). Both airplanes were carrying a high volume of fuel, which ignited upon impact and started large fires.
Due to the heat generated by the fires, the surrounding air was continually warmed up. Since warm air is less dense than cold air, it will rise under its own power due to buoyancy. The more significant the temperature difference, the more rapid the upward motion (even though both will float in water, think about how much harder it is to submerge an inflated beach ball than an ice cube). Remember that the atmosphere as a whole is stable, so the air further away from the fires will not be moving much. If you place a strong current of moving air next to air that's stationary, you're going to see a lot of turbulent eddies and vortices form.
To visualize this concept, grab something like a marker or a crayon and place it between the palms of your hands. Keeping one hand still, move your other hand so that the object you're holding begins rolling. As you might expect, the more quickly you move one hand, the object will rotate more quickly and more forcefully. The same concept is happening in the atmosphere; the difference in wind speeds is creating strong turbulence by causing the air to roll.
Again, if you look closely at the smoke plumes on any footage, you can occasionally see some vortices (rolling motions) within the smoke plume, especially in the space between the Twin Towers (it should be noted that the turbulent eddies are more numerous than they might appear since only the eddies that capture smoke will be visible).
This was significant for a couple reasons. First, strong and persistent turbulence is extremely hazardous to helicopters. Some camera angles show news helicopters on the scene, and you'll notice the helicopters are very far away from the towers (the turbulence would be maximized near the towers). Second, the weak winds and stable conditions kept the smoke close to the towers, which visually obscured the roofs of each tower. Both of these factors made it impossible for a helicopter to safely land on the roofs.
The rapidly rising hot air also had another effect. Whenever a fluid (i.e. air or liquid) is in motion, an area of relatively low pressure is created. In the atmosphere, this means that surrounding air is drawn toward the low pressure. Consequently, some of the air near ground level was forced upward toward the low pressure created by the rising hot air. Although this effect is not very noticeable, even a light upward motion could suspend (or at least slow down) any lightweight debris (mostly paper). Some videos taken near the towers show numerous pieces of paper struggling to reach the ground.
Animation depicting how an updraft (rising current of air) creates an area of low pressure, which the surrounding air moves toward. The black arrows represent turbulent eddies.
Tall skyscrapers have a reputation for generating their own weather patterns. Whenever strong winds blow against the face of a tall tower, the wind can be deflected upward along the sides of the tower. However, in a stable atmosphere, the wind is more likely to blow around the perimeter of the tower than up the sides. Since there wasn't much wind, this effect would not be very noticeable, but there is reason to believe that the rising air discussed in the preceding paragraph may have encouraged more upward deflections than would otherwise be observed.
The turbulence and upward motions were likely more vigorous near the South Tower due to the less centralized point of impact. As a consequence, more of the ambient air was in direct contact with the fire, which caused the ambient air to warm up (and rise) more rapidly.
These effects were not as noticeable at the Pentagon, which was impacted by American Airlines Flight 77 at 9:37 AM EDT. The fires at the Pentagon occurred much closer to the ground, which is a significant source of drag (friction). While some turbulent eddies can be seen in the smoke plume from cameras near ground level, the ground heavily impedes any air that will attempt to flow toward the heat source. This relative lack of turbulence allowed some helicopters to safely land near the crash site wherever the ground was flat and clearly visible.
Fortunately, the winds were too weak to favor extreme fire behavior near any of the crash sites (including that of United Airlines Flight 93). Strong winds are capable of blowing flames horizontally while also carrying embers great distances, which can start additional fires far away from the original fire. This is what makes fighting wildfires so challenging and so dangerous. Since many windows in the Twin Towers were shattered by the impact of the airplanes, the light winds were able to blow any loose debris (mostly paper) out of the buildings. Some of this debris was still burning when it was lofted out of the towers, but the light winds kept this debris close to the site of the emergency. Had the winds been stronger, fires may have been started in more distant locations and any fires that did start would have been difficult to extinguish.
At the Pentagon and in Pennsylvania, the crashes occurred much closer to the ground where the winds are weaker. This largely prevented any loose burning debris from escaping the crash sites. In contrast, the Twin Towers were struck at a relatively high altitude where the winds were a bit stronger (probably between 10 and 15 mph based on weather balloon data), but not strong enough to ignite additional fires miles away from the World Trade Center complex.
At 9:59 AM EDT, the South Tower collapsed (56 minutes after being hit), followed by the North Tower at 10:28 AM EDT (102 minutes after being hit). In the process of both collapses, a large dust cloud containing toxic substances was dispersed throughout the area. This will be something to discuss in great detail since there are a lot of mechanisms involved here.
The first thing to note is that any object that is moving through a fluid creates a region of relatively high pressure and a region of relatively low pressure. If you begin driving a car westward, high pressure will accumulate on the west side of the car, because the motion of the car is packing air molecules closer together. Immediately behind the car is a relative absence of air molecules, creating a low pressure in the car's "wake". This is the reason why drafting, although a potentially dangerous practice, does increase the fuel efficiency of vehicles since there is less air resistance.
Animation depicting how an object in motion (a car in this case) alters the air pressure and flow patterns around the object. The low pressure in the object's wake usually has the greatest influence on the air flow.
Remember that air will be drawn towards areas of low pressure. That means air will rush into the wake of any object that is moving through the atmosphere. In the car example, air will be drawn toward the moving car's rear. If the low pressure is strong enough, the rushing air can impart some noticeable force on the moving object itself and any other nearby objects. You've probably experienced this effect before. If a vehicle drives past you, sometimes there is a noticeable push toward the vehicle's wake (especially if the vehicle driving next to you is something big like an 18-wheeler).
The same effect is also evident in the collapsing towers. As the top of each tower descends toward the ground, the surrounding air attempts to move toward the area of low pressure in its wake. If you watch video footage of the collapse, you may notice currents of smoke and dust being pulled towards the collapsing tower from above. This clearly shows that wind currents are blowing downward onto the collapsing tower. While this doesn't have a major effect on the progressive collapse, that descending air will have a major effect on the dust cloud once it reaches the ground.
If you were to pour water onto a solid surface (like a table), the water would begin dispersing in all directions. The faster the water descends, the further the water is able to travel. The same thing happened with the towers; the descent of the tower itself and the wind pushing into its wake caused the dust-filled air to disperse in all directions with a significant amount of force. It is likely that the wind gusts near the point of collapse exceeded 75 mph given the damage that was done to nearby objects. What's worse is these strong winds were forced to travel through the narrow spaces that separate buildings, which caused some additional accelerations of the wind. This ultimately allowed the dust to travel great distances, easily reaching the banks of the Hudson River and the East River.

Animation depicting the pressure pattern and streamlines (air flow) with a collapsing tower. Unlike the car example, the collapsing tower is accelerating downward, which leads to rapidly decreasing pressure and rapidly increasing air flow. Once the collapse is over, the downward moving air spreads out rapidly along the ground since it can't go through the ground. As this occurs, the air from above quickly rushes downward to fill the lower pressure, which leads to a brief region of high pressure before the flow pattern begins to return to normal again.
This also means that the air between the collapsing portion and the standing portion is getting compressed, forming an area of high pressure. The air responds by rapidly flowing away from the region of compression. This flow pattern is most evident in the collapse of the North Tower where a sudden outward burst of flames can be seen when the collapse first begins. Consequently, any loose items that were still in the tower (many of which were probably still burning) were quickly blown out of the tower in all directions.
Even worse, the stable atmosphere prevented the dust from rising upward while it was in motion. An unstable atmosphere might have allowed more of the dust to be deflected upward, which would have limited how far the dust cloud could have traveled. Furthermore, the stable atmosphere kept the toxic dust close to the ground for a long time, increasing exposure to humans and animals. It took several days for the airborne dust to completely disperse, at which time a much stronger cold front helped improve conditions by introducing stronger winds that pushed the dust out over the water.5
Surface observations on September 14, 2001 at 1200Z (8:00 AM EDT).
Notice the wind barbs over New Jersey and New York are out of the northwest at 10-15 knots (12-17 mph). Unlike the previous cold front that featured weak winds, the stronger winds behind this cold front proved to be more beneficial by relocating much of the toxic dust away from populated areas.
As a side note, some cameras that were close to the towers captured the sound of the collapse very clearly. The sound can be described as a massive and continuous "roar" or "whoosh", which is also how several eyewitnesses near the collapsing towers described it. In fact, the sound is not too dissimilar to what would be heard near a violent tornado. The underlying physical principle is essentially the same: a large area of strong low pressure with the surrounding air rushing toward the low pressure.
Part III: Aftermath
In some respects, the weak cold front that passed through New York City on September 11 may seem like a net negative. However, it is important to remember that this cold front also prevented a major hurricane (Erin) from getting any closer to New York City.6 Furthermore, this front provided another benefit: cooler and drier air. Remember that the conditions on the previous day were warm and very humid. Had these conditions persisted, search and rescue operations would have been complicated by an uncomfortable air mass. Not only would this be a potential hazard to responders, survivors would have been subjected to these stresses as well. On the evening of September 11, the temperature was about 72 °F in both New York City and Washington, DC without much humidity in the air. Without that cold front, it might have been 80+ °F with high humidity during the rescue operations, much like it was a few days prior.
The stable conditions also prevented other hostile weather elements from occurring. Many people were outdoors watching the horrific scene at and near the World Trade Center site. Unstable conditions might have triggered thunderstorms (perhaps even severe thunderstorms), which can be hazardous to anyone outdoors. This also would have been a nightmare from an emergency management standpoint if responders had to deal with casualties and fires caused by the weather in addition to the massive crisis at hand.
A growing research avenue in the field of meteorology involves the logistical issues presented by large urban areas. Evacuating a metroplex like New York City on short notice is practically impossible. Instead, specialized computer models are being developed to determine what areas in a city should be evacuated if something hostile is released into the air (this could be a biological agent, poisonous gas, a dirty bomb, or toxic dust). Since wind patterns in large cities can greatly vary from block to block, it is extremely difficult for a forecaster (or a team of forecasters) to discern the most susceptible areas on their own. Hence the need for specialized computer models that are also reasonably accurate and (most importantly) always up-to-date. If this technology and knowledge were available at the time of the attacks, perhaps fewer people would have been exposed to the smoke and to the toxic dust produced by the towers' collapse.
Emergency managers have also been running hypothetical scenarios that involve unlikely (but not impossible) combinations of disasters to be as prepared as possible. One scenario that was almost realized was a Category 3 hurricane landfalling in the New England area after the Twin Towers were hit. If that cold front had been a 24-48 hours slower, that may have actually happened (depending on what the rest of the atmosphere was doing).7 Naturally, after things had settled down, some emergency managers began asking themselves "What would we have done if that hurricane hit New York after the towers were hit?".8
While another 9/11 is extremely unlikely, an unfortunate coincidence of disasters doesn't necessarily have to involve something as malevolent as 9/11. Suppose a Category 5 hurricane hit Florida at the same time as something like the Surfside Condo Collapse, which occurred in June 2021. Or, you could have a major tornado going through someplace like the Dallas/Fort Worth metroplex just after a commercial airliner crashes in a densely populated residential neighborhood. These scenarios are extremely unlikely to occur (and probably won't occur in your lifetime), but the probability is not 0. Furthermore, these sort of scenarios demand tough answers to tough questions about what the best emergency response would be, which is why people are paid to concoct these scenarios and figure how to best address them with the limited resources that would be available.
Epilogue
I've done my best to provide as comprehensive of an analysis as I could, but I also realize that other professionals out there who specialize in the relevant topics might have some additional (or even different) insights. If you have some technical knowledge that you wish to contribute to this article, please contact me at:
david.w.stang-1@ou.edu
If you were born after 9/11 or were too young to remember that day, I'd strongly recommend watching the wall-to-wall news coverage and the countless videos recorded by people near the disaster. It's one thing to read about 9/11 in an online article or a history book. To best understand what happened that day, I believe it necessary to see for yourself how people reacted to the attacks as they unfolded. If you're under 18, you'll want to get your parents' or guardian's permission first given how disturbing and upsetting the footage can be.
Some people may ask why I ultimately pursued this avenue of historical research. On the 20th anniversary of the attacks, I watched a 6-hour archive of news coverage (7:00 AM EDT to 1:00 PM EDT) exactly as it would have been televised 20 years ago. This required synchronizing the video with my local time (and waking up before 6 AM on a Saturday morning). Prior to the attacks and the attendant wall-to-wall coverage, that particular archive talked about Hurricane Erin producing rough waters along the East Coast. That ultimately kickstarted my own independent investigation into the meteorological aspect of that day.
Footnotes
1 Typically, the atmosphere is most stable just before sunrise, and this has to do with the fact that Earth's surface cools off during the night. The cold front compounded this effect by keeping the ground-level air cold, despite the increasing warmth from the rising sun. Unfortunately, the attacks also coincided with this timeframe of near-maximum stability in the atmosphere, which meant that anything released into the air was going to stubbornly stay near ground level. That said, the atmosphere would have remained stable in the afternoon due to the cold front passage, but the magnitude of stability would have been reduced slightly due to some degree of daytime heating.
2 Local wind patterns are a major consideration in the planning, design, and construction of urban areas. The last thing anyone wants is for the wind to blow pollution from industrial zones toward their homes and businesses on a constant basis. Wind patterns become even more important in the designing of high-rise buildings, because winds typically get stronger as altitude increases (creating what structural engineers often call "shear stress"), and winds typically change direction as altitude increases (creating what structural engineers often call "torsional stress"). The taller the building, the more wind stress it will have to deal with. The Twin Towers, being over 1300 feet tall, had to be engineered to endure some very significant wind stresses, especially considering the surface area on each façade of the buildings. Had the winds been stronger on September 11th, the towers probably would have collapsed sooner, and the falling debris would have been spread out over a larger area.
3 Other infamous examples of weather-related aviation accidents include Avianca Flight 52, Korean Air Flight 801, and Air Florida Flight 90. Poor visibility near ground level was present for the Avianca and Korean Air flights while icing was responsible for the crash of the Air Florida flight.
4 Most sources will place the blame on the pilot of the B-25 bomber for ignoring a recommendation to not attempt a landing. A well-known near miss that involved the World Trade Center in 1980 was Aerolineas Argentinas Flight 342, which occurred during similar circumstances (poor visibility due to fog).
5 A couple things to note here. 1) Some sources say the toxins remained in the air until the following summer in 2002. However, by that point in time, the concentrations were too low to be consistently visible to the naked eye. 2) The strong winds also probably lifted up some toxic dust that had settled on to the ground, but this cold front ultimately had a net positive effect considering how much dust was in the air prior to the cold front's arrival.
6 There's a well-known weather satellite image that captured the position of Hurricane Erin and the dust cloud from the collapsed towers at 1439Z (10:39 AM EDT). By this time, the cold front has begun weakening the hurricane while steering it away from the coastline. Still, this shows just how close New York City came to an even more unimaginable disaster.
7 It is also entirely possible that Hurricane Erin might have foiled the attacks altogether by canceling the flights that would be hijacked. That said, if you project a path that subtracts out the influence of the cold front, Erin makes landfall near Connecticut on September 13th, 2001.
8 It should be noted that some emergency managers have been running these hypothetical scenarios before 9/11. One of the earliest hypotheticals that is also publicly available explored the possibility of the May 3rd, 1999 tornado outbreak occurring in the Dallas/Fort Worth metroplex instead of Oklahoma. However, this conversation about comprehensive preparedness and covering all the bases became increasingly serious after 9/11 and even more so after Hurricane Katrina.
References
NOAA: Storm Prediction Center Map Archive
NOAA: National Hurricane Center Report on Erin (2001)
The Weather Channel Article About Hurricane Erin (2001)
CBS Article About Hurricane Erin (2001)
FAA: Analysis of Weather-Related Accident and Incident Data Associated with Section14 CFR Part 91 Operations
NPR: The Day A Bomber Hit The Empire State Building
History: 9/11: How Air Traffic Controllers Managed the Crisis in the Skies
www.stuffintheair.com (Air Pollution Photograph)
The following videos:
VIEWER DISCRETION ADVISED
YouTube: 9/11 As It Happened
YouTube: Naudet Brothers 9/11 Documentary
YouTube: 9/11 1st Tower Collapse WTC2 Compilation Footage
YouTube: 9/11 attacks in realtime (dashboard) 7:46am-12:00pm
YouTube: 9/11/2001 AVIATION AUDIO TRANSMISSIONS (ATC, FAA, & NORAD) [AUDIO ONLY]
Additional Information
9/11 Memorial & Museum Website
A lot of personal stories can be found at this museum in New York City where the original World Trade Center complex used to be.
YouTube: A 9/11 Survivor's Story - Brian Clark
Brian Clark tells his story about how he met and rescued Stanley Praimnath while escaping the South Tower after the second airplane hit.
YouTube: 9/11: Flying Toward an Erratic Flight 93 & Airline Emergencies with Capt. Brian Schiff
Brian Schiff, a commercial airline pilot who was flying at the time of the attacks, tells his story about 9/11.
YouTube: NJ Burkett reflects on being on-air when the South Tower collapsed
N.J. Burkett, an ABC reporter, was standing across the street from the Twin Towers when the South Tower began to collapse. In this 4-minute clip, Burkett explains how that experience affected him.
YouTube: 9/11 American National Anthem Buckingham Palace
Video clip of the Star Spangled Banner being played outside of Queen Elizabeth's residence during the Changing of the Guard. Since the year 1660, the tradition was for the Coldstream Guards to never play a foreign national anthem. The Queen ordered this tradition be broken in the aftermath of the attacks.
PBS Kids: April 9th (Part 1) | Arthur
PBS Kids: April 9th (Part 2) | Arthur
An extremely well-written episode of Arthur teaches its audience about trauma and how people can deal with trauma. This episode was specifically created in response to 9/11 because many children saw the horrors (either on TV or in person) of the attacks and/or lost a loved one in the attacks.
AccuWeather: The Weather of 9/11
This is the most comprehensive article about atmospheric conditions on 9/11 I could find in the public domain (prior to the upload of this article).